Enterprise Dash Board
  Marketing and Sales
  Finance
  Human resource
  Ecommerce
  Distribution and Supply chain
  Risk Analysis
  Operations
 
LONESTARMIS Enterprise Dashboard Business Intelligence Enterprise Dashboard
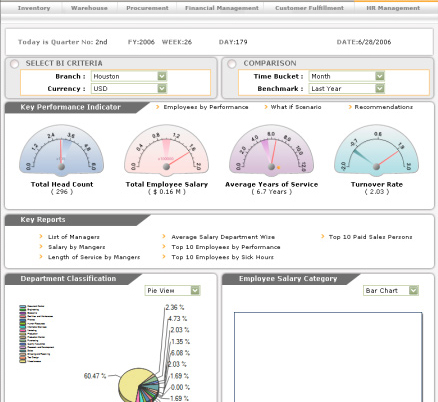
LONESTARMIS Enterprise Dashboard Enterprise Dashboards gives you a 360 view of your business spanning across key functional areas helping you make informed decision faster. It provides details on trends, key performance Indicators and drill down reports.

Just like flying an airplane is unimaginable without the cockpit gauges, similarly running a business in this competitive environment requires effective monitoring and analysis. LONESTARMIS Enterprise Dashboard provides you the ability to monitor business activities.

LONESTARMIS Enterprise Dashboard key functional areas are
  • Inventory management
  • Warehouse management
  • Procurement
  • Financial management
  • Sales/customer fulfillment
  • Human resource management.
Its reporting feature provides you with detailed reports in each of the different business areas with the drill down capabilities. Using LONESTARMIS Enterprise Dashboard Business Intelligence Enterprise Dashboard gives you the ability to make better and informed business decisions on the go.

So what is a dashboard?

Dashboards and Graphical visualization are cognitive tools that improve your "span of control" over a lot of business data and business processes. These tools help people visually identify trends, patterns and anomalies and help reason what they see and guide them towards effective decisions. As such, these tools need to leverage people's visual capabilities. With the emergence of dashboards, scorecards and other visualization tools, business users can now review their data in a very comprehendible form thereby aiding them in making timely decisions with greater accuracy.


LONESTARMIS Enterprise Dashboard Enterprise Dashboard features include

  • List of Key Performance indicators (KPIs) in graphical format and comprehensive drill down reports accessible anytime and anywhere on the globe through Web Browser
  • Dashboard Chart Processing provides the means to quickly assess trends, metrics, relative performance based on multiple management methodologies (KPI, Balanced Scorecard) for rapid insight
  • Charts are refreshed in real time at intervals you determine
  • The detailed data behind the chart is available for inquiry, printing or export
  • Express performance results and derivatives quickly in visual format showing the trend of events.
  • Analyze and report throughout the organization and map across the enterprise value chain
  • Monitor Danger zones and alerts about them, user can define threshold levels to set indicators and trigger alerts.
  • Customizable to multiple business processes of an enterprise.
  • Based on powerful Microsoft® SQL Server™ 2005 thus providing reliability and scalability.
The challenge and promise of business intelligence revolves around providing employees with the right information, at the right time to accomplish their set goals. Making this promise a reality requires a business intelligence solution that is comprehensive, secure, integrated with operational systems, and available 24/7, 365 days of the year. LONESTARMIS Enterprise Dashboard Enterprise Dashboard along with Microsoft SQL 2005 provides this powerful business intelligence solution.
 
Request a real time demo. Please fill the form. One of our represetative will contact shortly. click here


Download brochure
© Copyrights 2012 LONESTAR MIS LLC, All Rights Reserved